Look at a typical power spectrum of a periodic signal - here the Van der Pohl oscillator driven at frequency 1.05 and in the locked regime. As before, refine the spectrum by increasing Speed and hitting Start - this corresponds to accumulating more power spectra of length Points in the averaging. (You can also set Allow Sleep to No if this doesn't crash the program!)
There is no windowing of the data, and each FFT is from 256 points accumulated at a time interval of "Interval" x dt, i.e. of 0.4 . You should accumulate the power spectrum for some time until the trace no longer changes significantly with time. (The initial plot from just a single FFT shows artifacts due to the particular phasing of the signal relative to the data window.)
A large fundamental at the frequency of 1.05 is evident, together with two, or perhaps three, harmonics. However the peaks are quite broad, and there is a "floor" at about the 10-5 level, coming from the "tail" of the main peak, that obscures the higher harmonics.
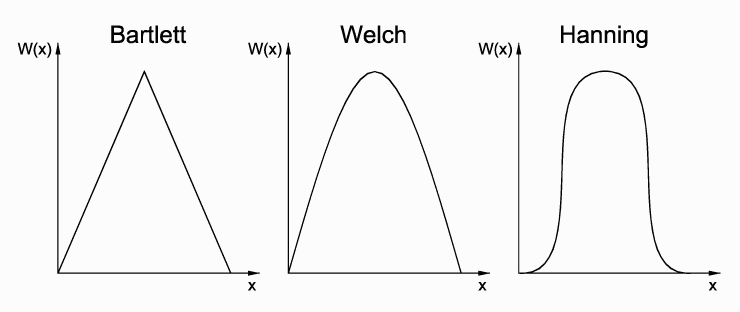
First we will study how "windowing" the data affects the plot. The three window functions are shown in the figure:
| WinNum | Window | Description | Singularity in: | Demonstration |
| 0 | None | Top Hat | Function | |
| 1 | Bartlett | Tent | First derivative | |
| 2 | Welch | Parabolic | First derivative | |
| 3 | Hanning | Sinusoidal | Second derivative |
The "ideal" spectrum of course is a set of sharp spikes at the fundamental and its harmonics. In comparing the spectra for the various windows with this ideal (e.g. the height of the peak relative to the background or artifacts) you should note that the vertical, logarithmic, scale may change between the plots.
From these plots you might get the impression that the Hanning window is better in all respects. This is not the case: the Hanning window visually appears narrower than, say, the Welch window, and indeed it has the effect of "throwing away" more of the data. This means that if you look at the peaks in the power spectrum rather than the tails, the Welch window gives narrow peaks (e.g. a smaller width at half maximum).
Return to text.